Hydrological Monitoring
(Click on thumbnail to enlarge)
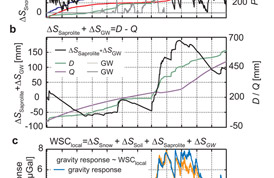
 Figure 2: a) Time series of lysimeter weight (ΔSSnow+ΔSSoil), snow water equivalent (SWE), precipitation (P), evapotranspiration (ETa) and drainage (D). b) Water storage changes in the saprolite and groundwater (ΔSSaprolite+ΔSGW), drainage from lysimeter (D) and groundwater discharge (Q). c) SG residuals and the hydrological gravity response derived with the lysimeter approach.
Effective water management and use depends on quantifying the hydrological cycle and accurately measuring water reserves both on the surface as lakes, rivers, snow cover and glaciers and underground as soil moisture and groundwater. Since 90 % of all unfrozen fresh water is hid- den underground, it is difficult to determine its volume. Standard hydro- logical techniques are inadequate for collecting continuous and compre- hensive data on water storages change (WSC) at the field or catchment scale in a non-invasive way.
Soil moisture measurements are crucial for agricultural production. However, soil moisture probes are limited to ~2 m depth and measure only a small volume that cannot represent average properties on the agricultural field scale.
Groundwater provides half of the USA population with drinking water, yet monitoring wells only monitor local changes in height. Additional expensive wells and pump tests are needed to estimate the properties and water storage of the aquifer, and results have a high level of uncertainly.
The deep vadose zone controls groundwater recharge as well as transport of contaminants from land surface to groundwater. However, no adequate monitoring technique has yet been developed for continuously monitoring this critical zone.
The potential for using gravity to monitor underground WSC and the forward modeling of temporal gravity changes resulting from WSC are well understood [e.g., Leirião, et al., 2009; Pool, 2008]. A horizontal infinite sheet of water placed at any distance below a gravity meter will produce a signal Δg = 42 μGal per meter of water. Spring-based gravimeters have been used to study hydrological effects, but are limited by their precision of ~15 μGal to very large WSC such as human-induced groundwater depletion. Because of their larger variable drifts, spring gravity meters cannot be used to study natural systems with smaller temporal hydrological variations. Absolute gravity meters have a lower detection limit (accuracy ~2 μGal) but do not allow for the continuous observation of WSC [Jacob et al., 2008]. In contrast, superconducting gravity meters, with their high stability and precision, are ideal for measuring WSC of either small or large hydrological mass changes over years to decades.
Temporal gravity observations and water storages
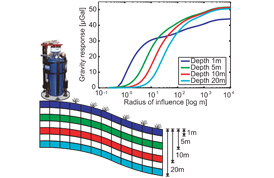
 Figure1: Gravity response due to a one meter thick water change in a layer distributed along the topography. The radius of influence is inve- stigated by increasing the radius of this layer and calculating the gravity response. The effect of different water storages, like soil moisture or groundwater is simulated by moving this layer into different depths.
Superconducting gravimeters (SG) are currently the best performing gravimeters in terms of precision and temporal resolution to study gravity variations over time. The SG gravity residual signal, which is the gravity signal reduced from well-know effects (i.e. solid Earth tides, ocean tide loading and polar motion and mass changes in the atmosphere) is a direct measure of local hydrology and attains sub-μGal precision [e.g. Hinderer et al., 2007; Van Camp et al., 2006; Longuevergne et al., 2009].
Figure 1 demonstrates that gravity signals from soil moisture or ground- water at their different depths can be of similar magnitude but the radius of influence varies for different hydrological storages. Therefore, hydro- logical models must include all zones to accurately reproduce the gravity signal. In addition, it means that gravity measurements cannot determine the depth of signal sources, so additional hydrological data must be used to interpret the gravity signal. Figure 1 also shows that topography must be carefully modeled since it can amplify signals to be 20% greater than the infinite plane approximation of 42 μGal per meter of water.
A recent study of Creutzfeldt et al. [2010b] investigated the influence of local hydrological mass variation on gravity measurements. WSC were estimated using a weighable, suction-controlled and monolithic lysimeter [von Unold and Fank, 2008] in combination with groundwater ob- servations, soil physical measurements and a hydrological 1D model. Combining measurements with a hydrological model allowed for the prediction of temporal water mass variations in the overall hydrological system from which the gravity response could be independently calcu- lated. Figure 2 shows the high correlation between gravity calculated from the hydrological model and the measured SG residuals.
For this relatively small WSC, the maximum gravity change is only 10 μGal which is common for many natural hydrological systems. Addition- ally, Figure 2 shows the importance of continuous measurements which allow correlation with other hydrological parameters. In particular, the lysimeter change in snow and soil moisture (ΔSSnow + ΔSSoil) shows the rapid effects of snow and rainfall on gravity, while water changes in the saprolite and groundwater (ΔSSaprolite + ΔSGW) take place much more gradually and have a stronger seasonal component. These results show that the SG is a promising new hydrological tool to tackle the limi- tations of classical hydrological monitoring systems.
Calibrating a hydrological model using SG gravity residuals
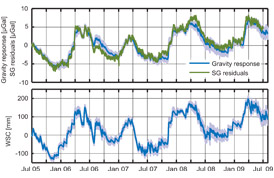
 Figure3: Time series of the measured SG residuals, the modeled hydrological gravity response at the top and the corresponding modeled water storage change at the bottom.
Hydrological models are tools to help understand and quantify water storages in a hydrological system. Typically, meteorological data (pre- cipitation, temperature, etc.) are input into the model, and model param- eters are calibrated to match the output fluxes, usually river discharge. Discharge is used to characterize the water storage but the storage-output relationship is usually unknown and difficult to define. Point measure- ments of soil moisture and groundwater are helpful; however, they are not a measure of total water storage and are limited by high spatial and temporal variability. In contrast, SG gravity measurements integrate all storage components over a large area and provide a measure of the total WSC that can be used to constrain a hydrological model. SG residuals are similar in nature to discharge measurements in that they integrate over snow, soil moisture and groundwater storage. However, since SG residuals provide a direct measure of the change of the hydrological sys- tem, conclusions about the storage of an area can be determined indepen- dently from the discharge and storage-output relationship.
In a recent study by Creutzfeldt et al. [2010a], the SG signal was used to cali- brate the parameters of a hydrological model. Figure 3 shows the results of a hydrological model that was calibrated against SG residuals. As input data, precipitation, potential evapotranspi- ration and snow height were used and the model parameters were automati- cally calibrated using the SG residual data only. The top panel of Figure 3 shows that the gravity signal generated by the hydrological model closely re- produces the SG residuals over several strong seasonal variations. The lower panel shows the variation in water storage from the hydrological model.
This study demonstrates how the SG can help to characterize the catchment status above the outlet point and contribute to understanding catchment dynamics and constraining hydrological models.
Benefits of iGRAV®
- Easily transportable - lower weight and small size
- Simplified and remote operation
- Continuous 1 sec gravity data
- Constant calibration factor
- Ultra low linear drift less than 5 μGal/year
- Sub μGal Precision: ≈ 0.02 μGal @ 100 s
- Tilt stabilized
- Cost efficient
New hydrological tool
- Direct measure of water storage change
- Continuous and non-invasive
- Properties measured at the field scale
- Includes snow, vadose and aquifer zones
- Precision to < 1 mm change in water level
- For hydrological model calibration/validation
- Integrative gravity signal is similar in nature to water discharge measurements.
Further areas of application
Agricultural Water Management
Management of soil moisture is crucial for efficient agricultural production. The iGravTM SG provides a continuous measure of soil moisture for efficient plant growth management.
Waste disposal sites / contaminated areas
Chemical and radioactive waste disposal sites can contaminate water resources severely impacting human health and the environment. The iGravTM SG can help to quantify hydrological flow processes in the (deep) vadose and saturated zone, something for which no other adequate technique exists. This is critical for pre-exploration, monitoring and remediation of waste disposal areas.
Runoff generation
Where water goes when it rains and what pathway it takes to the stream channel are very basic questions. However, understanding these processes is difficult because it is only possible to monitor surface water and not the runoff generation process. Discharge measurements characterize a catchment at its outlet, but analysis is difficult for areas far away from the river, which significantly influence the runoff process. Several iGravTM SGs strategically located could monitor the catchment to understand the runoff generation process. This could lead to improved prediction of extremes like floods or droughts.
Groundwater management
It is difficult to determine the amount of water stored underground, yet this information is necessary for effective groundwater management. This dilemma is especially true for karstic or fractured aquifers, which are major water reserves in some regions of the world. Combining iGravTM SG temporal gravity measurements with water level observations can determine the drainable porosity over depth, which is necessary for characterizing aquifer properties, especially fractured ones.
Potential other application areas:
- geothermal energy
- salt water intrusion
- subsidence due to groundwater withdrawal
- landslides
download
![]() Hydrological Monitoring (PDF - 582KB)
Hydrological Monitoring (PDF - 582KB)


 Print This Page

